Choosing the Right Python Library for Your Data Pipeline Needs
Written on
Chapter 1: Introduction to Data Processing in Python
When embarking on a data project in Python, a common initial question for both novices and seasoned data scientists is: which library is most suitable? The answer isn't straightforward, as it ultimately depends on the specific requirements of the task at hand. In the realm of computer science, the key lies in selecting the right tool for the job. Here, we will delve into three remarkable Python libraries that can simplify the creation of data pipelines: Pandas, Spark (PySpark), and Polars. This discussion will highlight the essential features of each library, offer practical usage examples for data processing tasks, and provide a comparison of their syntax and performance using a Kaggle dataset.
To illustrate the capabilities of these libraries, we'll utilize the Flight Status Database sourced from Kaggle. This dataset, which comprises over 4 million rows from 2022, is sufficiently large to reveal the varying behaviors of each library. The fields included in the dataset are as follows:

Chapter 2: Pandas - The Versatile Data Manipulation Tool
Pandas stands out as an excellent choice for small to medium-sized datasets, equipped with a comprehensive range of functions for data manipulation. As the most widely used data analysis library, it is often the go-to option. We will focus our analysis on fundamental features and transformations using Pandas. For instance, we can group the DataFrame by airline and calculate various statistics concerning departure and arrival delays.
import pandas as pd
flight_file = '/kaggle/input/flight-delay-dataset-20182022/Combined_Flights_2022.parquet'
df = pd.read_parquet(flight_file)
df_agg = df.groupby(['Airline'])[['DepDelayMinutes','ArrDelayMinutes']].agg(['mean','sum','max'])
df_agg.head()
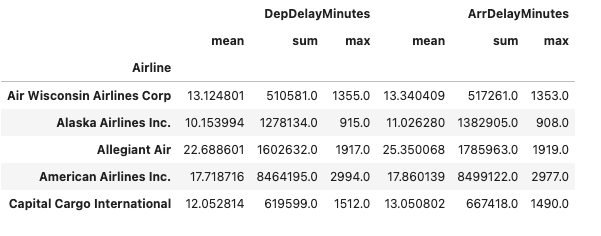
It is important to remember that when working with Pandas, the dataset must be small enough to fit into your computer's memory. Regardless of speed considerations, the size of your data and available computing resources will determine whether Pandas is suitable for your project. When running the same code using the timeit command, we find that it averages approximately 4.14 seconds for execution.

Chapter 3: Polars - The High-Performance Alternative
Polars is a newer library, established in 2020, that emphasizes speed and memory efficiency, making it a compelling option for larger datasets. While it shares similarities with Pandas in terms of data manipulation, it has been optimized for performance. For example, instead of using the read parquet function from Pandas, Polars employs scan parquet to create a lazy DataFrame, deferring computations until the final collection step. This allows for optimization as the library anticipates the necessary computations.
import polars as pl
pl.scan_parquet(flight_file).group_by(['Airline']).agg(pl.col('DepDelayMinutes').mean().alias('avg_dep_delay'),
pl.col('DepDelayMinutes').sum().alias('sum_dep_delay'),
pl.col('DepDelayMinutes').max().alias('max_dep_delay'),
pl.col('ArrDelayMinutes').mean().alias('avg_ar_delay'),
pl.col('ArrDelayMinutes').sum().alias('sum_ar_delay'),
pl.col('ArrDelayMinutes').max().alias('max_ar_delay')).collect()
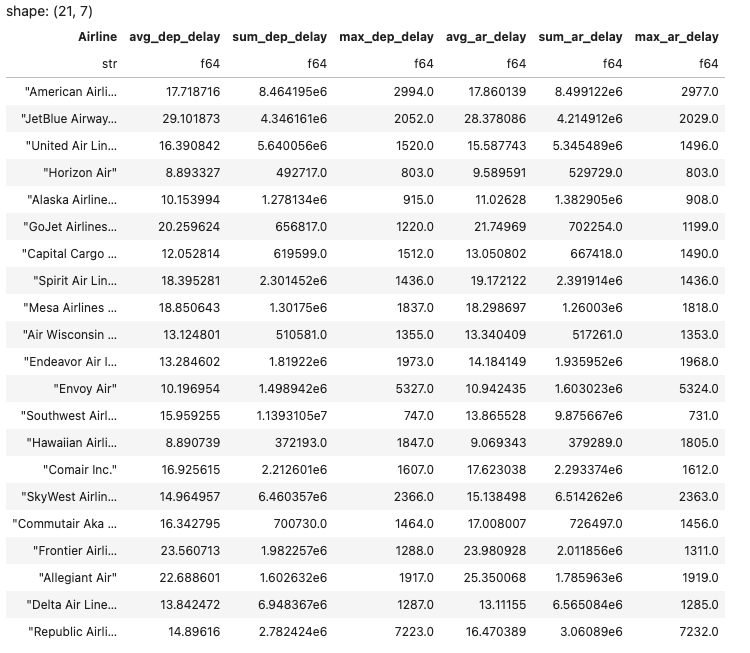
The code structure for Polars is quite similar to that of Pandas. When examining the values for the airline "Allegiant Air," you'll find that the numerical results match those computed with Pandas. However, a significant difference emerges when assessing execution speed.

The same pipeline now executes in just 447 milliseconds, making it approximately ten times faster than the Pandas version. In scenarios involving much larger datasets or extensive transformations, the performance benefits of Polars become even more pronounced.
Chapter 4: PySpark - Harnessing Distributed Computing Power
PySpark is a preferred choice for handling large datasets, particularly in corporate settings, due to its inherent distributed processing capabilities.
from pyspark.sql import SparkSession
import pyspark.sql.functions as F
spark = SparkSession.builder.master('local[1]').appName('medium_blog_post').getOrCreate()
df_spark = spark.read.parquet(flight_file)
df_spark_agg = df_spark.groupby('Airline').agg(
F.avg('DepDelayMinutes').alias('avg_dep_delay'),
F.sum('DepDelayMinutes').alias('sum_dep_delay'),
F.max('DepDelayMinutes').alias('max_dep_delay'),
F.avg('ArrDelayMinutes').alias('avg_ar_delay'),
F.sum('ArrDelayMinutes').alias('sum_ar_delay'),
F.max('ArrDelayMinutes').alias('max_ar_delay'),
)
display(df_spark_agg)
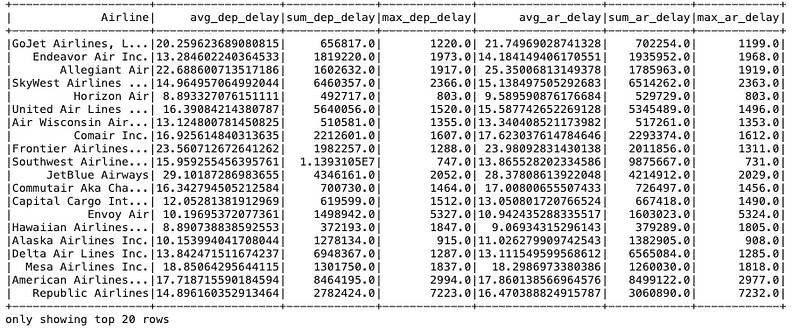
The initial step with PySpark involves creating a Spark session that runs in the background, requiring a designated name, in this case "medium_blog_post." While our current example does not leverage Spark's full potential for distributed processing across multiple machines, this capability is a key advantage for handling datasets that exceed the memory capacity of a single machine.
Similar to Polars, PySpark also utilizes lazy execution, meaning computations are deferred until data is collected or displayed. The execution time for the PySpark code averages around 230 milliseconds, making it the fastest among the three libraries. This advantage is likely to increase as dataset sizes grow.

For those familiar with SQL but not these Python libraries, a valuable feature of Spark is the ability to run SQL queries directly, eliminating the need for Python-specific syntax. The following code snippet achieves the same results as the previous PySpark example but is expressed entirely in SQL.
from pyspark.sql import SparkSession
import pyspark.sql.functions as F
spark = SparkSession.builder.master('local[1]').appName('medium_blog_post_sql').getOrCreate()
spark.sql("DROP TABLE flight")
spark.sql(f"CREATE TEMPORARY VIEW flight USING parquet OPTIONS (path "{flight_file}")")
query ="""SELECT airline,
avg(DepDelayMinutes) as avg_dep_delay,
sum(DepDelayMinutes) as sum_dep_delay,
max(DepDelayMinutes) as max_dep_delay,
avg(ArrDelayMinutes) as avg_ar_delay,
sum(ArrDelayMinutes) as sum_ar_delay,
max(ArrDelayMinutes) as max_ar_delay
FROM flight
GROUP BY airline"""
display(spark.sql(query))
The execution time remains comparable, so using SQL does not significantly impact performance.
Chapter 5: Conclusion - Selecting the Right Tool for Your Needs
In summary, each of these libraries presents unique advantages based on your specific requirements. If you are working with a cluster of machines and handling enormous datasets, PySpark is the optimal choice. For smaller datasets that fit into memory, where you need reliable transformations, Pandas is often the preferred option. If speed is your primary concern, Polars may be the best fit. In cases where CPU usage is constrained or dataset sizes are unpredictable, stability makes Pandas an attractive option.
If you found this article helpful, please consider showing your support by clapping or leaving a comment! Feel free to follow me on Medium for more insights into Data Science, and connect with me on LinkedIn for further engagement.
Chapter 6: Recommended Video Resources
To further enhance your understanding of data pipelines in Python, check out the following video resources:
The first video, titled "The BEST library for building Data Pipelines...", provides an in-depth look at the various libraries available for constructing efficient data pipelines.
The second video, "Automating Data Pipelines with Python & GitHub Actions [Code Walkthrough]", offers a practical walkthrough on automating your data pipeline processes.