Exploring Advanced Plotting Techniques in SymPy
Written on
Chapter 1: Introduction to Advanced Plotting
When utilizing Python's symbolic mathematics library SymPy, generating basic plots is straightforward with functions like plot(). However, guidance on more sophisticated plotting methods is somewhat limited. Fortunately, since SymPy leverages robust plotting libraries such as Matplotlib and Bokeh, there is a vast array of capabilities at your disposal. This article introduces you to these advanced features and what they can achieve.
Daily Dose of Scientific Python
Explore common and uncommon challenges solved using Numpy, SymPy, SciPy, and Matplotlib.
Section 1.1: Setting Up for Advanced Plotting
To unlock advanced plotting functionalities, you need to install an additional package. Simply execute the command:
pip install sympy_plot_backends[all]
Once done, you are set to begin.
Subsection 1.1.1: A Basic Example
Let’s plot a straightforward function, ( f(x) = frac{1}{x} ), over the range from -1 to 1. This function presents a challenge due to its pole at ( x=0 ), which complicates the plotting process. The naive plot would appear as follows:
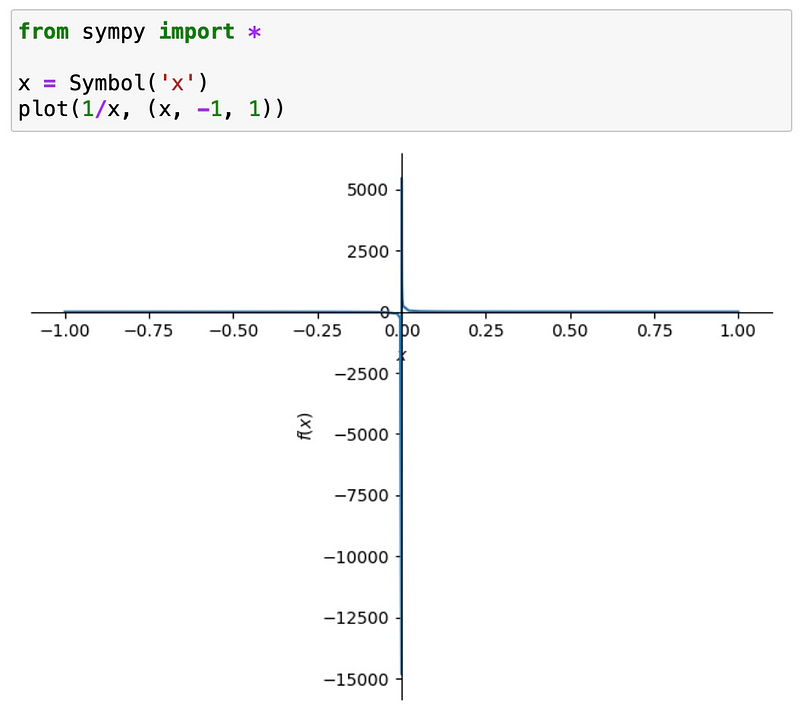
In your Jupyter notebook, after importing SymPy, ensure to also import the SymPy plotting backends (spb):
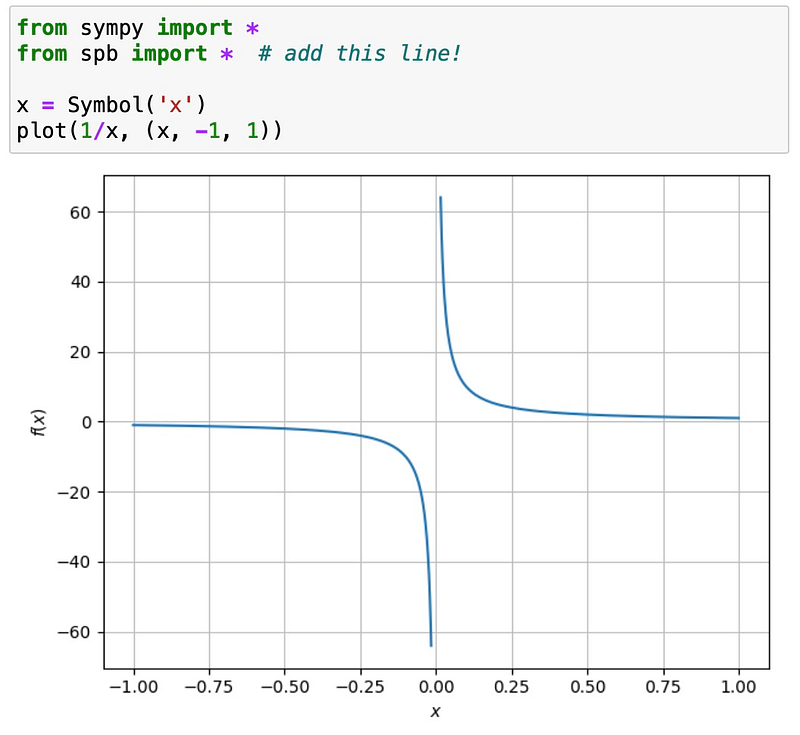
What a difference! This is just the beginning of what you can achieve.
Section 1.2: Handling Discontinuities
Let’s examine the gamma function, which serves as an interpolation for factorials. As you may know, the gamma function has poles at negative integer values. A naive plot yields:
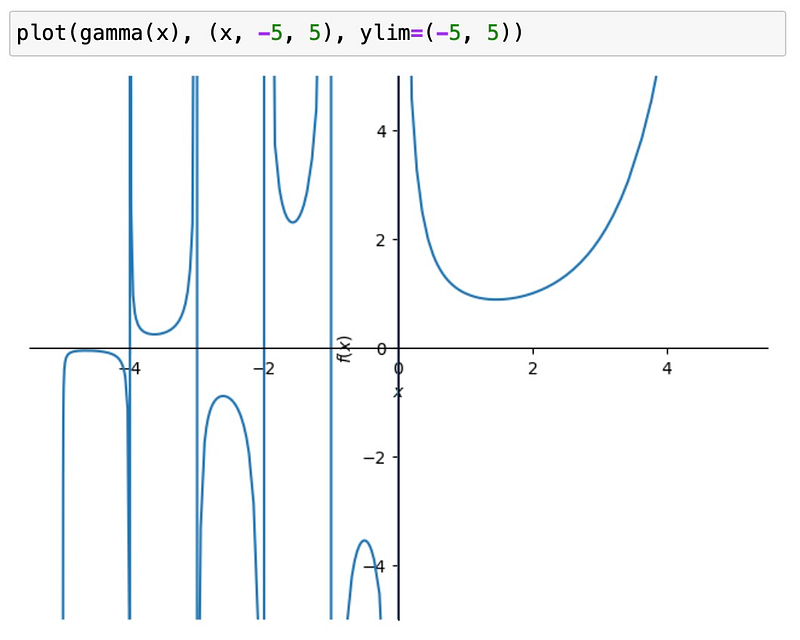
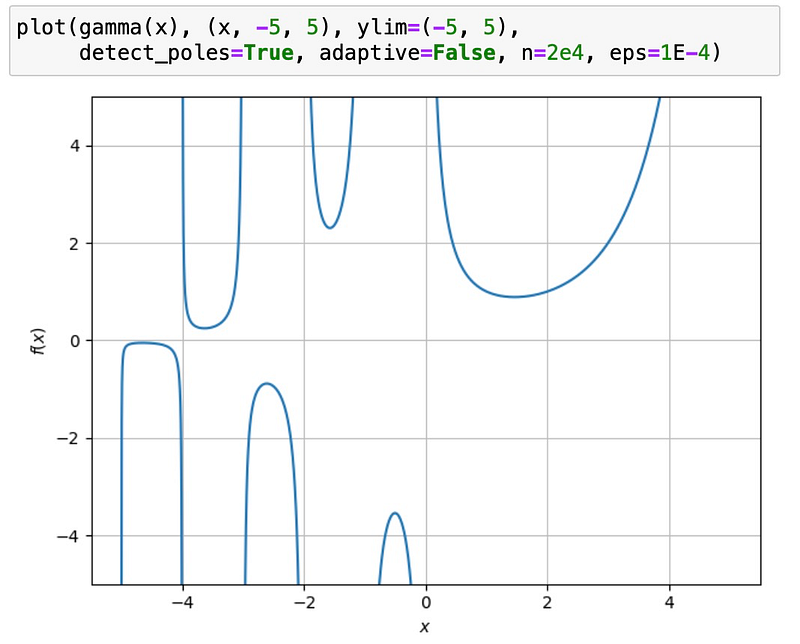
Typically, standard plotting connects points across poles, which is misleading. The spb add-on includes a discontinuity detector that rectifies this issue. By enabling the detect_poles option and adjusting the hyperparameters eps and n, you can greatly enhance the visual results:
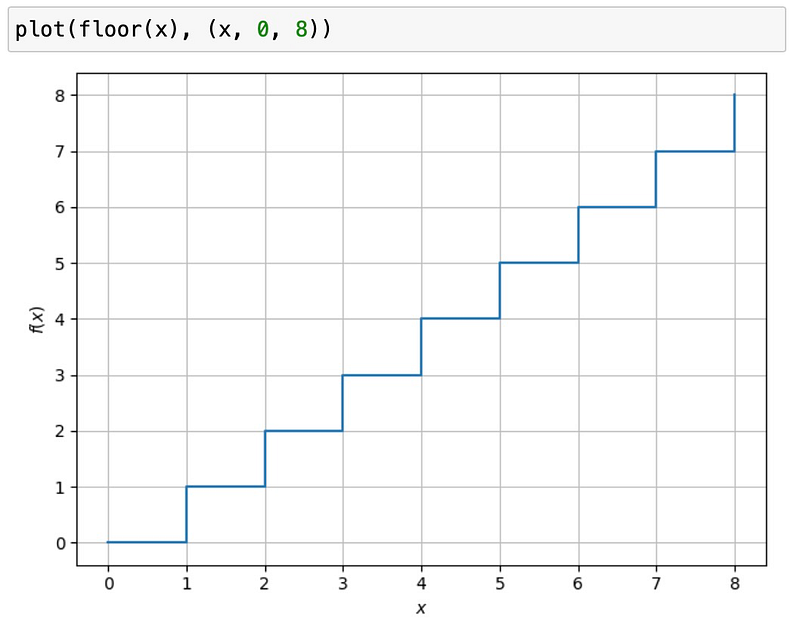
This feature also works with finite discontinuities, such as the step function. The unrefined plot appears as follows:
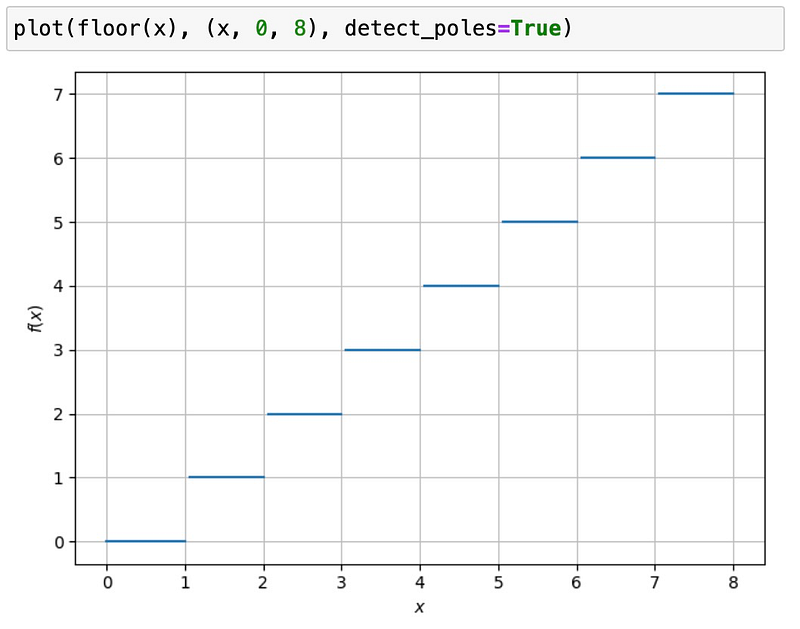
However, the pole detector cleans up the visualization:
Chapter 2: Fine-Tuning Your Plots
Passing Arguments to the Backend
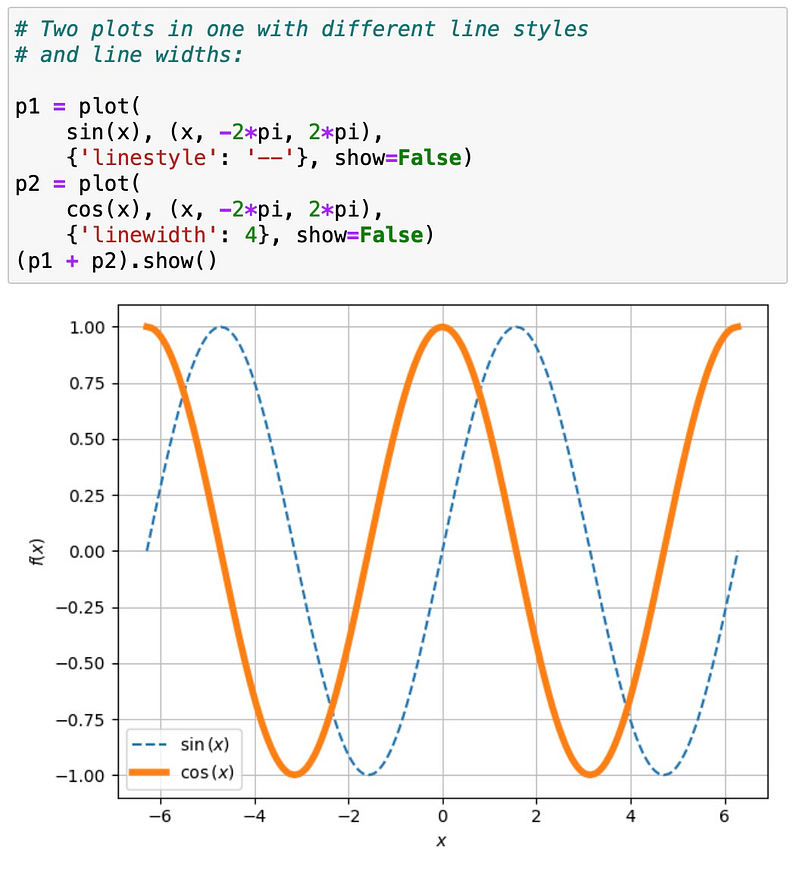
In vanilla SymPy, the plot function has limited options. For instance, while you can set the line color, changing the line style (e.g., dashed) is not possible. With the spb add-on enabled, you can extend these options! Here’s how to pass linestyle or linewidth to Matplotlib:
Section 2.1: Exploring Different Backends
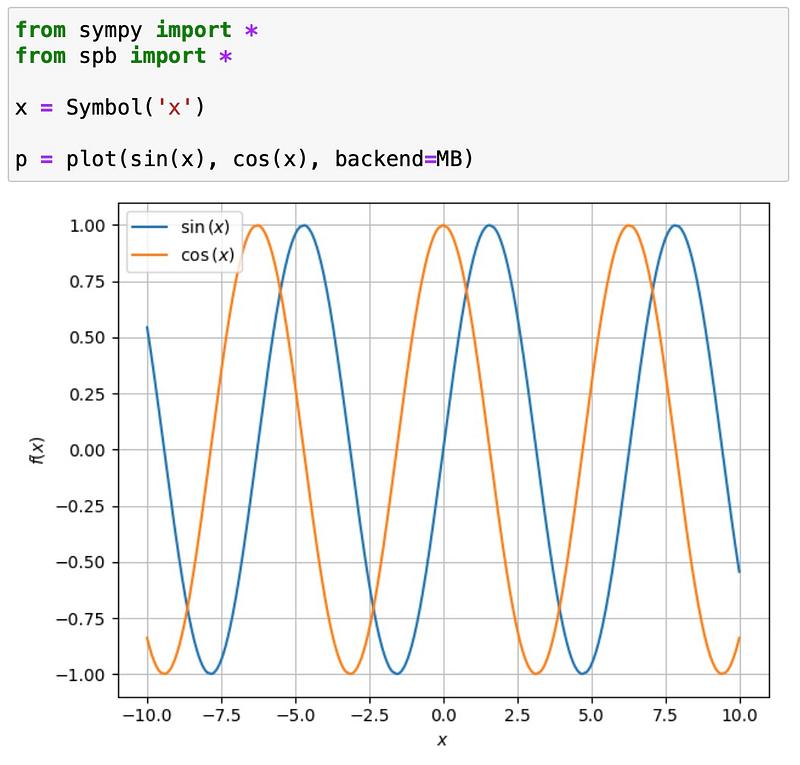
Three distinct 2D backends are available, with Matplotlib being the default. You can specify the backend using the backend argument. The options include:
- MB for Matplotlib
- BB for Bokeh
- PB for Plotly
While many options are interchangeable, the syntax can differ between backends, especially when passing specific parameters.
For example, utilizing Matplotlib produces a static plot:
Conversely, using the Bokeh backend provides interactivity, such as zooming:
Specialized Plotting Options
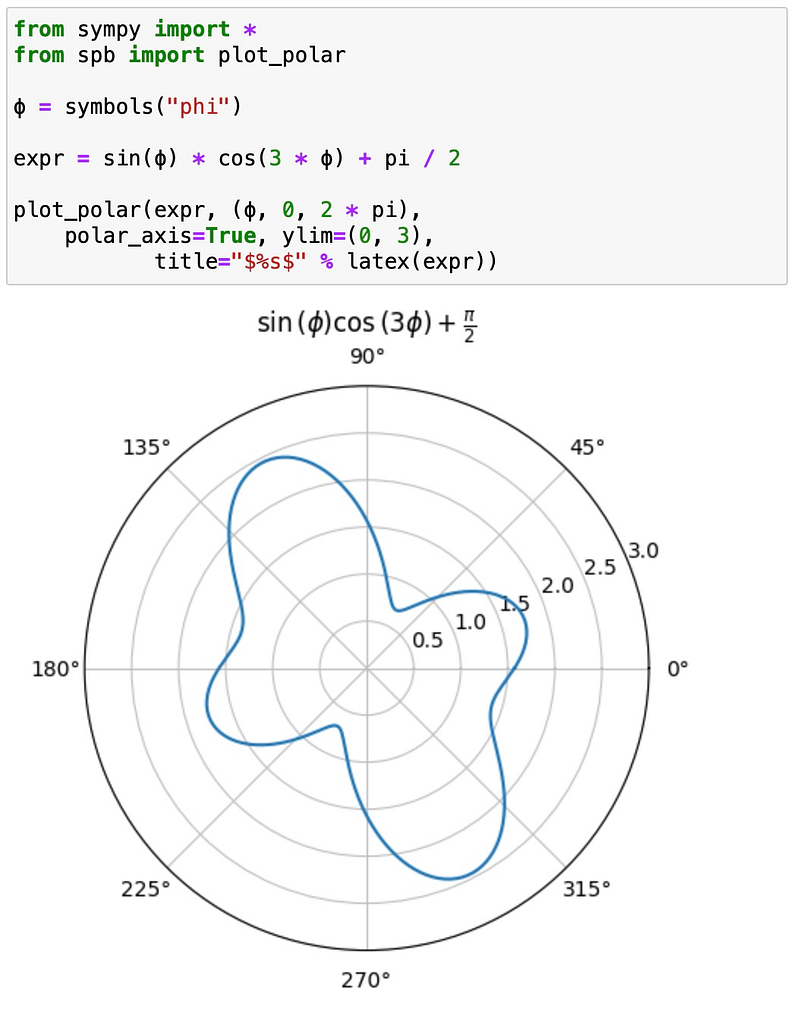
Thus far, we have focused on standard 2D plots, but there is much more to explore. For example, creating polar plots is straightforward with plot_polar:
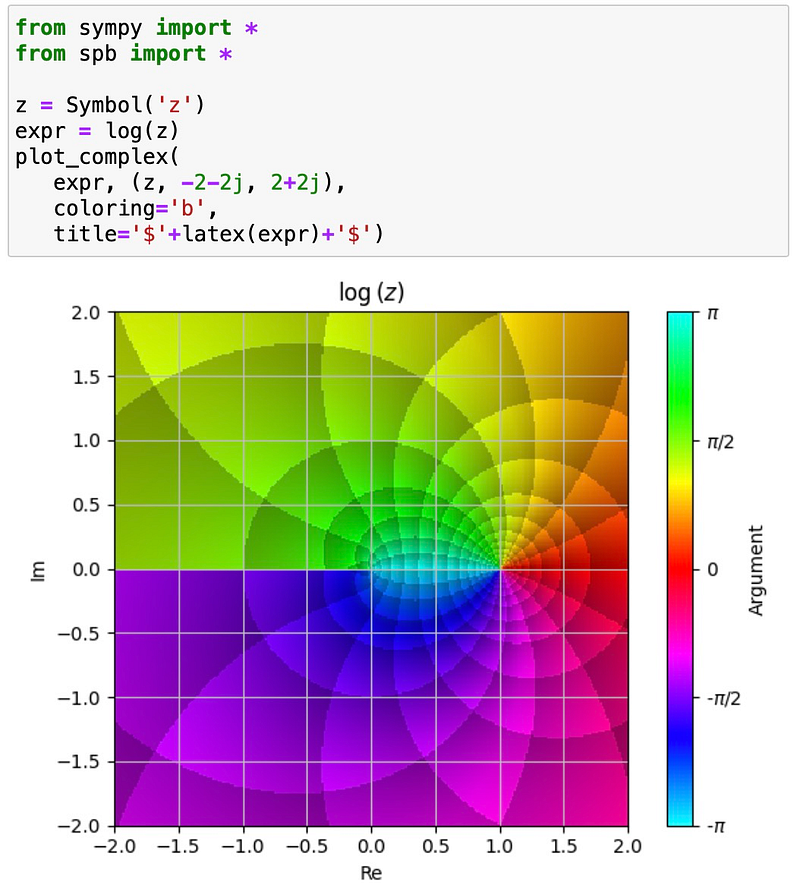
Complex functions can also be easily visualized using plot_complex. For instance, here is a depiction of the complex logarithm:
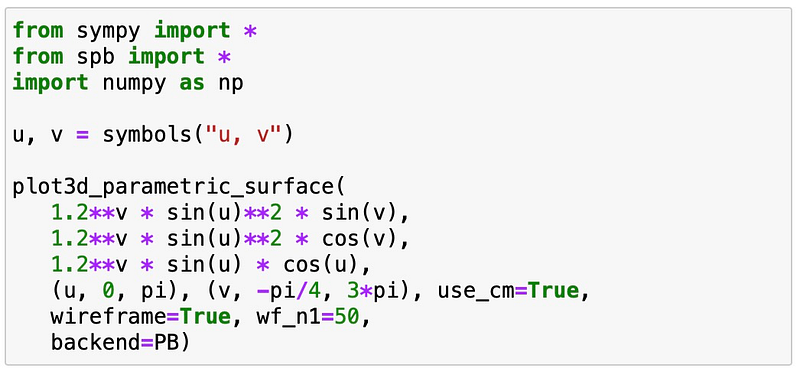
And to wrap up, SymPy's plotting capabilities extend into three dimensions, as demonstrated by this stunning nautilus:
Still not convinced? There's plenty more to discover. Stay tuned!
This video titled "Symbolic Math with SymPy: Advanced Functions and Plots" dives deeper into advanced functions and visualizations in SymPy.
In this video, "Plotting symbolic functions in SymPy," you will learn how to effectively plot various symbolic functions using the library.