Understanding BIRCH Clustering: A Deep Dive into Outlier Detection
Written on
Introduction to BIRCH Clustering
In this article, we delve into BIRCH clustering, a technique used in unsupervised learning to create hierarchical structures for data organization. BIRCH stands for Balanced Iterative Reducing Clusters using Hierarchies. This algorithm is particularly effective for:
- Handling large datasets
- Detecting outliers
- Reducing data size
The primary distance metric utilized in BIRCH clustering is the Euclidean distance.
Advantages of BIRCH
BIRCH clustering provides several benefits that make it a valuable tool in data analysis:
- It effectively manages noise within datasets.
- The algorithm is adept at identifying high-quality clusters and their sub-clusters.
- It is memory-efficient, requiring fewer scans of the dataset, thus minimizing I/O costs.
- Compared to DBSCAN, BIRCH generally offers superior performance.
Disadvantages of BIRCH
While BIRCH has its strengths, it also has limitations that researchers must consider:
- The algorithm can experience numerical issues when calculating distances, particularly with the SS (square sum) value, which may lead to reduced precision.
Video 1: This video demonstrates how to automate data cleaning and manage outliers using DBSCAN clustering in Python.
Understanding MiniBatchKMeans
When dealing with extensive datasets that exceed memory limitations, BIRCH may not suffice. In such cases, using mini-batches of a fixed size can significantly reduce runtime while maintaining efficiency. However, this approach can impact the quality of clusters.
Steps in BIRCH Clustering
The BIRCH algorithm involves four main steps:
- CF Tree Construction: The process begins with building a CF (Cluster Feature) tree from the input data, which includes three values: the number of inputs (N), the Linear Sum (LS), and the Square Sum (SS).
- Sub-tree Creation: The algorithm then searches for leaf entries in the initial CF tree to form smaller CF trees, removing outliers and organizing sub-clusters into the main cluster.
- Cluster Definition: Users can set a threshold parameter to specify the number of clusters. Agglomerative clustering is applied to leaf entries, creating clusters from CF vectors.
- Cluster Rearrangement: Finally, centroids are introduced to refine the clusters established in step three, aiming to reduce outliers.
Key Parameters in BIRCH
The main parameters for BIRCH clustering include:
- Threshold: Defines the radius of the sub-cluster. The default value is 0.5, and a lower value is recommended during initial settings.
- Branching Factor: This parameter determines the maximum number of sub-clusters in each node. If a new sample exceeds this count, the sub-cluster will split further. The default value is set to 50 branches.
- N_clusters: Specifies the desired number of clusters.
Practical Example with Python
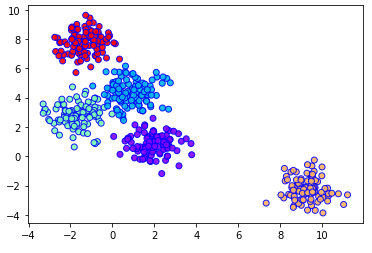
The following Python code illustrates how to generate five clusters from 500 random data points using BIRCH clustering:
import matplotlib.pyplot as plt from sklearn.cluster import Birch from sklearn.datasets import make_blobs
# Generating 500 random samples data, clusters = make_blobs(n_samples=500, centers=5, cluster_std=0.75, random_state=0)
# BIRCH Model model = Birch(branching_factor=50, n_clusters=None, threshold=1.5)
# Fitting the model to the data model.fit(data)
# Predicting the clusters pred = model.predict(data)
# Visualizing the clusters plt.scatter(data[:, 0], data[:, 1], c=pred, cmap='rainbow', alpha=0.9, edgecolors='b') plt.show()

Conclusion
BIRCH clustering stands out among clustering algorithms, particularly when compared to K-Means. It excels in outlier removal and memory efficiency. However, numerical issues regarding the SS value can be addressed by employing the BETULA cluster feature, which utilizes mean and deviation approaches.
Further Reading
- NLP — Zero to Hero with Python
- Python Data Structures: Data Types and Objects
- Data Preprocessing Concepts with Python
- Principal Component Analysis in Dimensionality Reduction with Python
- Fully Explained K-means Clustering with Python
- Fully Explained Linear Regression with Python
- Fully Explained Logistic Regression with Python
- Basics of Time Series with Python
- Data Wrangling With Python — Part 1
- Confusion Matrix in Machine Learning